Pre-canned product charts 
The instructions outlined on this page provide details on how you can deploy a set of Grafana dashboards specific to your provisioned DC product(s)
Pre-requisites
JMX metrics, Prometheus and Grafana will all need to be provisioned already to make use of this guide. For instructions on how to do this see, Monitoring with Prometheus
1. Enable Pre-canned dashboards 
Update the grafana stanza within the deployments values.yaml to enable dashboard creation with the appropriate labels i.e.
monitoring:
  grafana:
    createDashboards: true
    dashboardLabels:
      grafana_dashboard: "1"
grafana_dashboard value
The value to assign to the label dashboardLabels.grafana_dashboard can be obtained by examining Environment variables for the grafana pod sidecar grafana-sc-dashboard. For instance:
kubectl describe pod prometheus-stack-grafana-57dc5589b-2wh98 -n <prometheus-stack-namespace> | grep -A 20 grafana-sc-dashboard | grep -A 5 Environment
prometheus-stack-grafana-57dc5589b-2wh98) may vary slightly between deploys will return something like
Environment:
    METHOD:        WATCH
    LABEL:         grafana_dashboard
    LABEL_VALUE:   1
    FOLDER:        /tmp/dashboards
    RESOURCE:      both
grafana_dashboard, that is 1. As such the grafana stanza, above` has been updated with this value. Now perform an upgrade using the updated values.yaml:
helm upgrade confluence atlassian-data-center/confluence -f values.yaml --wait --namespace <namespace>
2. Dashboard confirmation 
Confirm the dashboards are provisioned and working by running (replace pod name with an actual Grafana pod name):
kubectl port-forward prometheus-stack-grafana-57dc5589b-2wh98 3000:3000 -n <prometheus-stack-namespace>
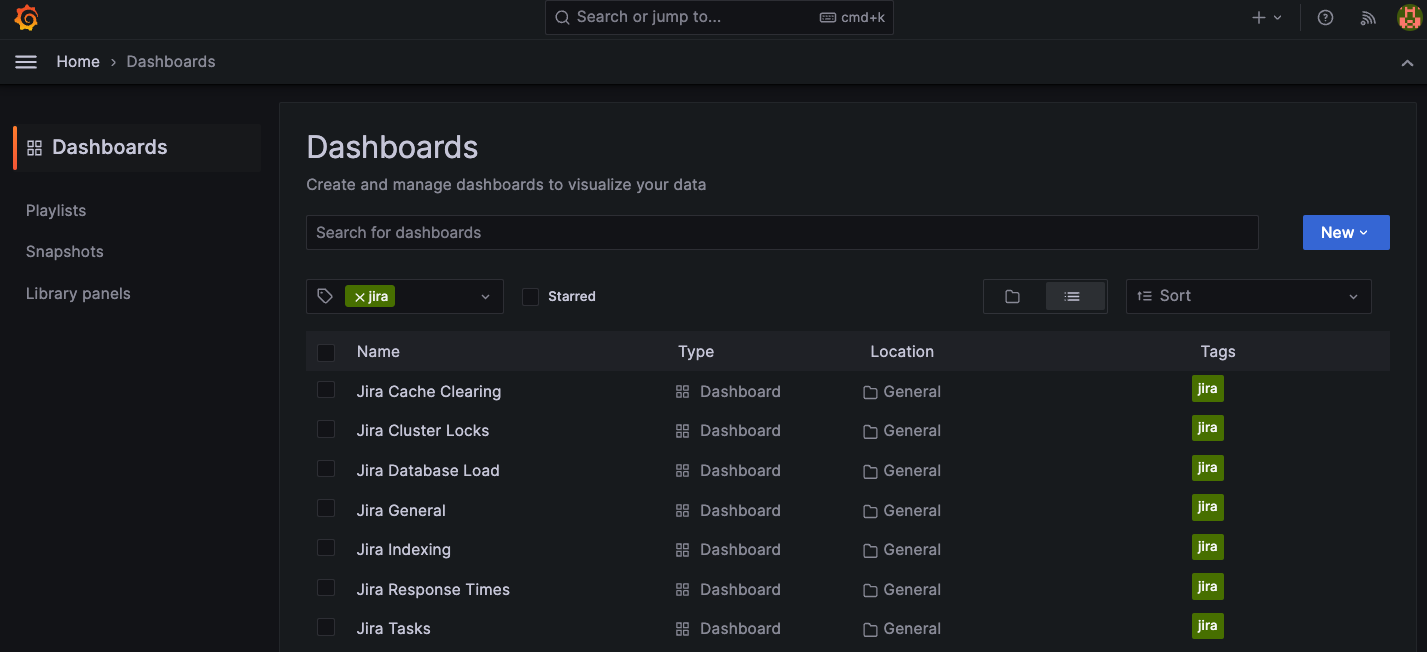
Now go to http://localhost:3000 in your local browser. Once logged into Grafana (The default credentials are admin:prom-operator) select Dashboards > Filter by tag > Product name. You should be presented with a list of product specific dashboards that can be viewed, for instance